
Monitoring & Reporting (91)
Children categories
Flood Risk/Hazard Mapping Reports (61)
Learn More:
- Contact Tyler Bauman, Water Resources Engineer (Flood Management)
In cooperation with local municipalities and the province, the RVCA identifies, studies and maps natural hazard areas along local rivers, lakes, streams and wetlands. Natural hazard areas include floodplains, unstable slopes. Natural features such as wetlands are also mapped. In the past, these maps were called flood risk maps.
If not understood or dealt with effectively, these hazards can pose risks and problems to society, especially when considering development activities.
Hazard mapping is used by watershed municipalities when updating Official Plan and Zoning Schedules and in the review of development applications under the Planning Act. The RVCA uses the mapping for the administration and enforcement of regulations made under the Conservation Authorities Act (Section 28).
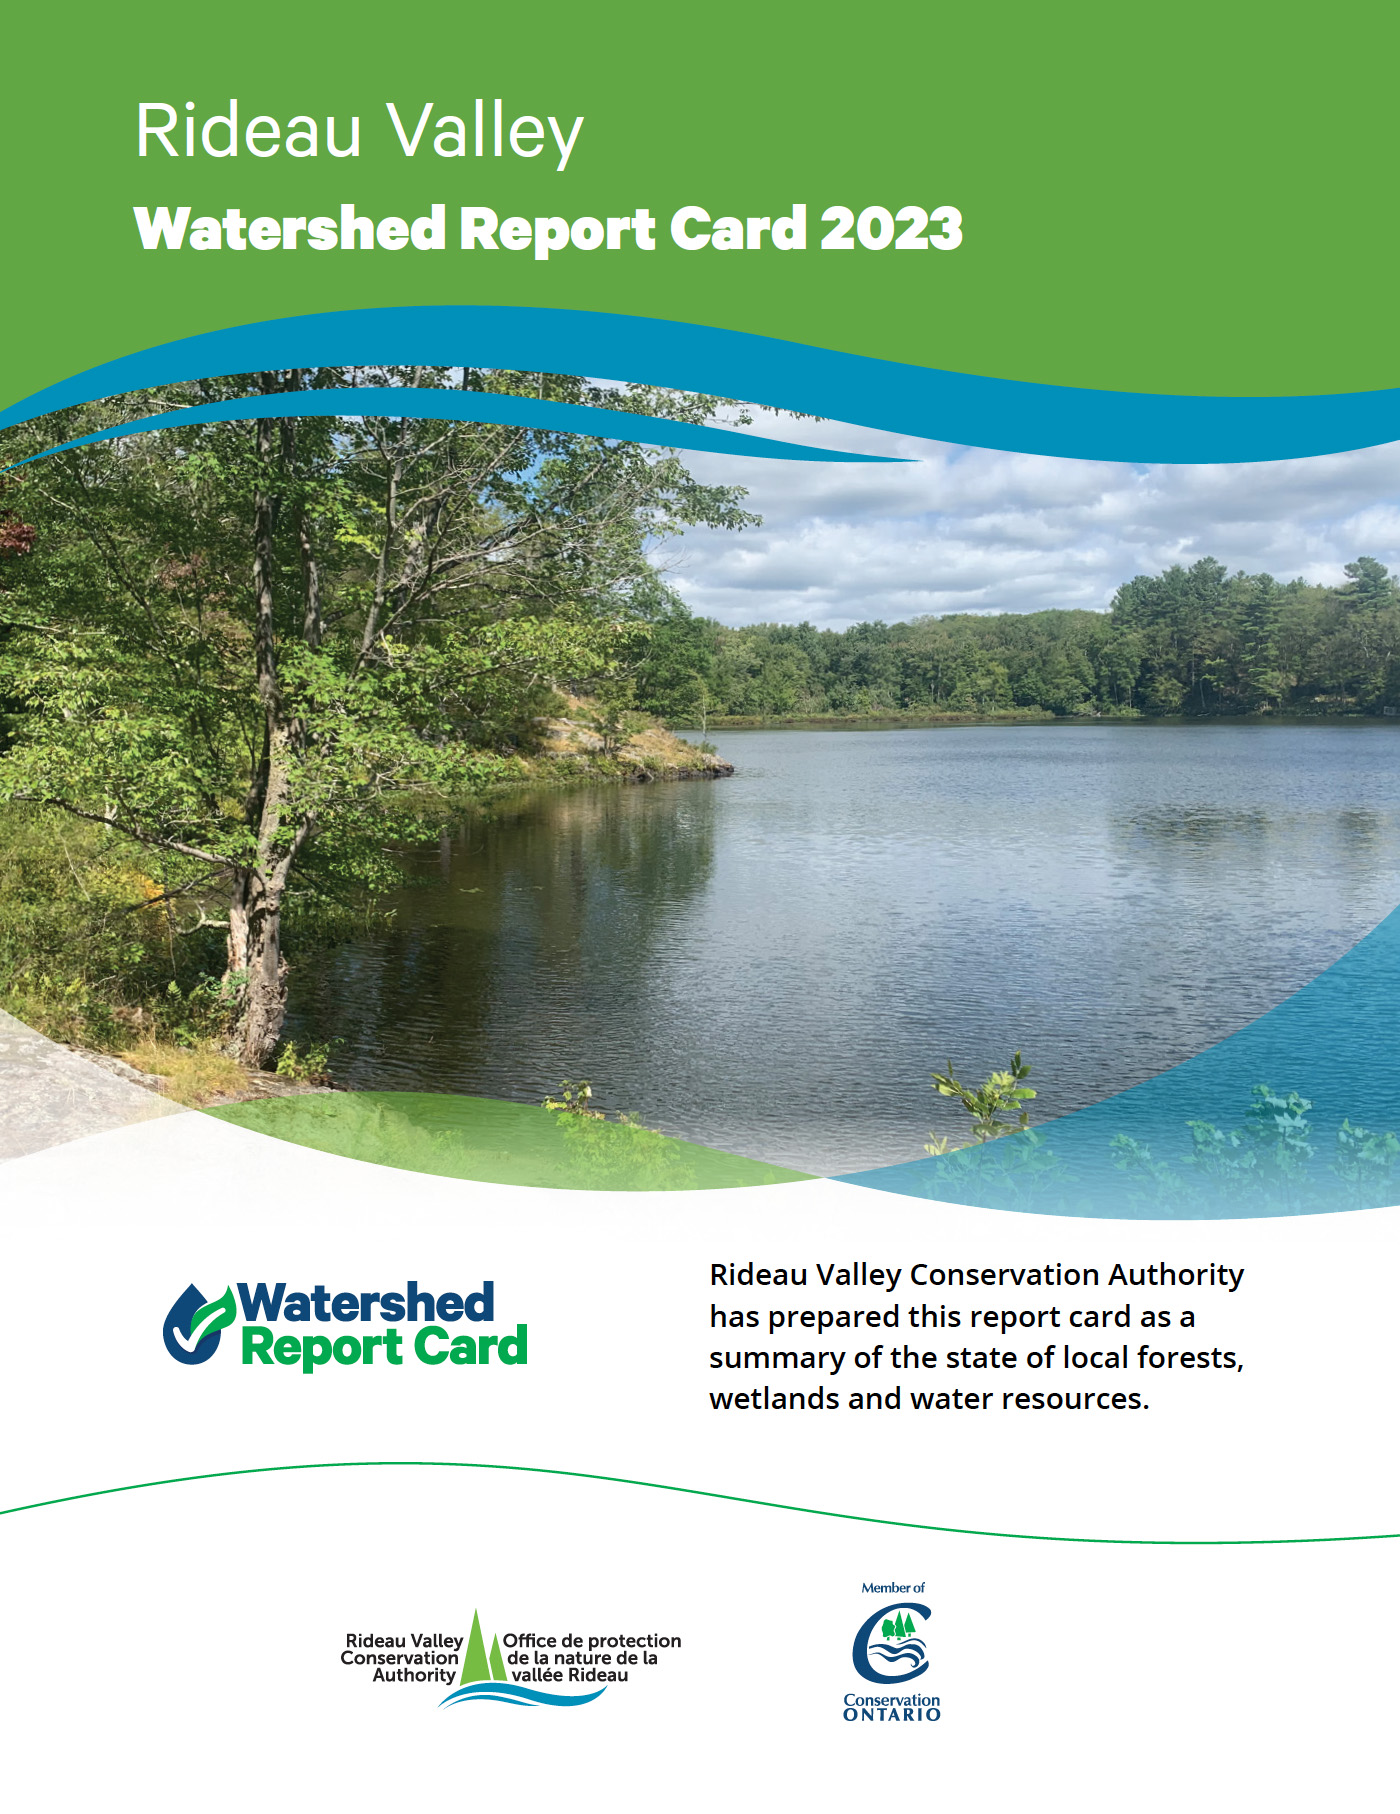
The 2023 RVCA Watershed Report Card.
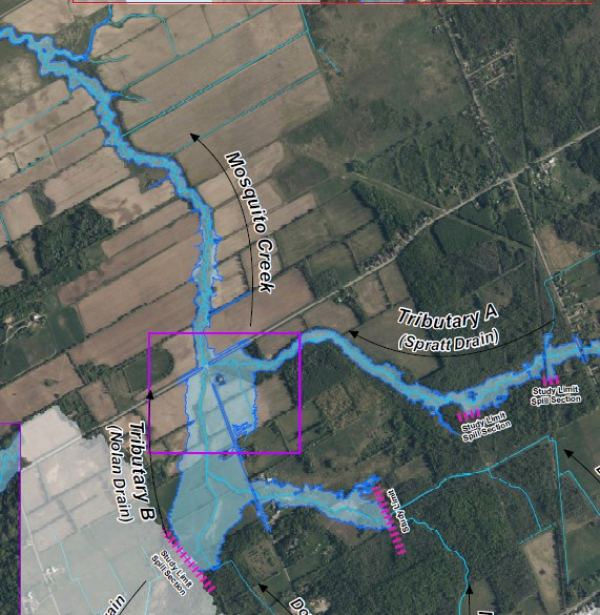
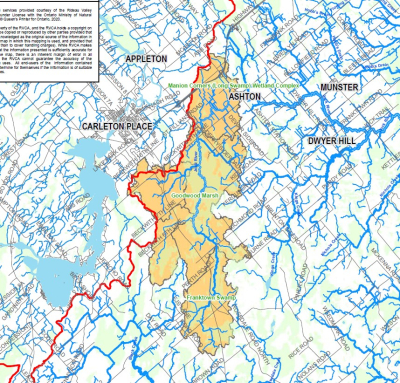
Mosquito Creek Flood Risk Mapping from Mitch Owens Road to Rideau River
Upper Jock River Flood Risk Mapping Study from Richmond Road to Ashton Station Road, July 2021
The RVCA collects, monitors and analyses watershed information.
Monitoring environmental conditions helps us see trends over time, focus our actions where they can do the most good, and evaluate the effectiveness of our watershed policies and programs.
Reporting information ensures the right information is available to municipal and watershed decision makers (including watershed residents).
Use the menu to the right to visit our monitoring and reporting information. You can also access information through our interactive mapping. See below for details on what is currently available.
Interactive Mapping Tool
Access information through our interactive mapping tool. Choose from these mapping options:
|
|
|
|
||
| Access our robust interactive mapping with multiple tools to help you find regulation limits, flood event depths, flood & low water status, landcover, conservation areas and more. |
See real-time and periodic information from a network of sources from across the watershed. |
View water quality data collected across the watershed. See where we test and the results. | Explore our subwatershed reports that highlight four indicators of watershed health: water quality, forest cover, wetland cover and riparian cover. | Search properties to see if it may be subject to Section 28 — Ontario Regulation 174/06 (Development, Interference with Wetlands and Alternations to Shorelines and Watercourses Regulation. |
Learn More:
- Current Water Conditions Statements (flood or drought)
- Contact Brian Stratton, Manager Engineering Services
Within the RVCA’s regulated floodplain, staff have identified a number of Flood Vulnerable Areas throughout the watershed where flood events may have an impact on nearby properties. (See watershed map and table).
A series of new Neighbourhood Flood Maps for 20 vulnerable City of Ottawa communities along the Ottawa and Rideau Rivers shows the potential extent of flooding for 1:2, 1:5, 1:10, 1:20, 1:50 and 1:100 year return period floods for these neighbourhoods.
NOTE: These maps are for informational purposes only and are not as exact as those used for regulatory purposes.
Please note:
- The 1:2 year return period flood event has a 50% chance of occurring in any year.
- The 1:5 year return period flood event has a 20% chance of occurring in any year.
- The 1:10 year return period flood event has a 10% chance of occurring in any year.
- The 1:20 year return period flood event has a 5% chance of occurring in any year.
- The 1:50 year return period flood event has a 2% chance of occurring in any year.
- The 1:100 year return period flood event has a 1% chance of occurring in any year.
All Rideau River Additional Flood Maps are based on recorded flow at the Rideau at Ottawa [02LA004] gauge, located at Carleton University. The two Grandview Ottawa River Additional Flood Maps are based on recorded flow at the Ottawa River at Britannia [02KF005] gauge. The Boise Village/Morin Road Additional Flood Map is based on recorded water levels at the RVCA Cumberland gauge.
DISCLAIMER: Users of the RVCA flow data and water level data are cautioned to consider the unverified nature of the information before using it for decisions that concern personal or public safety or the conduct of business. The Rideau Valley Conservation Authority assumes no responsibility for the correctness of the information contained in this website nor liability to any user of such information, regardless of the purpose. River levels and flows can change rapidly.
Station Metadata [SNOW-MNR-3310]
STATUS: Active, Seasonal
ABOUT THIS DATA:
The biweekly snow depth (cm) and snow water equivalent (mm) for the Manotick, Ontario region (SNOW-MNR-3310). Field monitoring conducted by the RVCA.
DATA TIME-SERIES:
Biweekly, Field Measurement, Snow Depth (SD); centimeters
Biweekly, Field Measurement, Snow Water Equivalent (SWE); millimeters
LOCATION: UTM 18T [X: 444445.2], [Y: 5010783.4]
SUBWATERSHED: Lower Rideau River
PERIOD OF RECORD (RVCA ARCHIVE): Jan/2008 - Present
OWNER/OPERATOR: Rideau Valley Conservation Authority
DATA AVAILABILITY: Biweekly field monitoring from Oct-June
STATISTICS: NA
DATA UNCERTAINTY:
The RVCA cannot guarantee the accuracy of the provided data. Data accuracy can be affected by a number of factors including, but not limited to: Equipment malfunction/maintenance, regional climate conditions and site disturbance. Users of the RVCA's data tools are cautioned to consider the unverified nature of the information before using it for decisions that concern personal or public safety or the conduct of business.
DATA SOURCES:
MNRF Snow Collection Protocol
CONTACT:
For for more information, please contact:
Station Metadata [SNOW-MNR-3306]
STATUS: Active, Seasonal
ABOUT THIS DATA:
The biweekly snow depth (cm) and snow water equivalent (mm) for the Pierces Corners region (SNOW-MNR-3306). Field monitoring conducted by the RVCA. Statistics have been generated by the RVCA from the period between 1977-2019 (42 years). These statistics include the biweekly median (50th percentile), interquartile range (data range between the daily 25th and 75th percentiles) and the maximum snow water volume measured over the period of record. The median and interquartile range represent the typical normal snow water volume observed at this time of year over the historic record.
DATA TIME-SERIES:
Biweekly, Field Measurement, Snow Depth (SD); centimeters
Biweekly, Field Measurement, Snow Water Equivalent (SWE); millimeters
Biweekly, Lower Quartile (25th Percentile; Historic Normal Water Equivalent); millimeters
Biweekly, Median (50th Percentile; Historic Normal Water Equivalent); millimeters
Biweekly, Upper Quartile (75th Percentile; Historic Normal Water Equivalent); millimeters
LOCATION: UTM 18T [X: 444984.3], [Y: 4988113.9]
SUBWATERSHED: Lower Rideau River
PERIOD OF RECORD (RVCA ARCHIVE): Jan/1977 - Present
OWNER/OPERATOR: Rideau Valley Conservation Authority
DATA AVAILABILITY: Biweekly field monitoring from Oct-June
STATISTICS: RVCA statistics calculated from the 1977-2019 period of record.
a) Upper Quartile (Historic Normal)
Statistics Interval - 1 Year, Recurring
Extraction Interval - Biweekly (15 Days); No Aggregation
Statistics Type: 75th Percentile
Update Frequency: Biweekly
b) Lower Quartile (Historic Normal)
Statistics Interval - 1 Year, Recurring
Extraction Interval - Biweekly (15 Days); No Aggregation
Statistics Type: 25th Percentile
Update Frequency: Biweekly
c) Median (Historic Normal)
Statistics Interval - 1 Year, Recurring
Extraction Interval - Biweekly (15 Days); No Aggregation
Statistics Type: 50th Percentile
Update Frequency: Biweekly
DATA UNCERTAINTY:
The RVCA cannot guarantee the accuracy of the provided data. Data accuracy can be affected by a number of factors including, but not limited to: Equipment malfunction/maintenance, regional climate conditions and site disturbance. Users of the RVCA's data tools are cautioned to consider the unverified nature of the information before using it for decisions that concern personal or public safety or the conduct of business.
DATA SOURCES:
MNRF Snow Collection Protocol
CONTACT:
For for more information, please contact:
Station Metadata [SNOW-MNR-3304]
STATUS: Active, Seasonal
ABOUT THIS DATA:
The biweekly snow depth (cm) and snow water equivalent (mm) for the Nolans Corners region (SNOW-MNR-3304). Field monitoring conducted by the RVCA. Statistics have been generated by the RVCA from the period between 1977-2019 (42 years). These statistics include the biweekly median (50th percentile), interquartile range (data range between the daily 25th and 75th percentiles) and the maximum snow water volume measured over the period of record. The median and interquartile range represent the typical normal snow water volume observed at this time of year over the historic record.
DATA TIME-SERIES:
Biweekly, Field Measurement, Snow Depth (SD); centimeters
Biweekly, Field Measurement, Snow Water Equivalent (SWE); millimeters
Biweekly, Lower Quartile (25th Percentile; Historic Normal Water Equivalent); millimeters
Biweekly, Median (50th Percentile; Historic Normal Water Equivalent); millimeters
Biweekly, Upper Quartile (75th Percentile; Historic Normal Water Equivalent); millimeters
LOCATION: UTM 18T [X: 424389.2], [Y: 4975304.8]
SUBWATERSHED: Middle Rideau River
PERIOD OF RECORD (RVCA ARCHIVE): Jan/1977 - Present
OWNER/OPERATOR: Rideau Valley Conservation Authority
DATA AVAILABILITY: Biweekly field monitoring from Oct-June
STATISTICS: RVCA statistics calculated from the 1977-2019 period of record.
a) Upper Quartile (Historic Normal)
Statistics Interval - 1 Year, Recurring
Extraction Interval - Biweekly (15 Days); No Aggregation
Statistics Type: 75th Percentile
Update Frequency: Biweekly
b) Lower Quartile (Historic Normal)
Statistics Interval - 1 Year, Recurring
Extraction Interval - Biweekly (15 Days); No Aggregation
Statistics Type: 25th Percentile
Update Frequency: Biweekly
c) Median (Historic Normal)
Statistics Interval - 1 Year, Recurring
Extraction Interval - Biweekly (15 Days); No Aggregation
Statistics Type: 50th Percentile
Update Frequency: Biweekly
DATA UNCERTAINTY:
The RVCA cannot guarantee the accuracy of the provided data. Data accuracy can be affected by a number of factors including, but not limited to: Equipment malfunction/maintenance, regional climate conditions and site disturbance. Users of the RVCA's data tools are cautioned to consider the unverified nature of the information before using it for decisions that concern personal or public safety or the conduct of business.
DATA SOURCES:
MNRF Snow Collection Protocol
CONTACT:
For for more information, please contact:
Station Metadata [SNOW-MNR-3311]
STATUS: Active, Seasonal
ABOUT THIS DATA:
The biweekly snow depth (cm) and snow water equivalent (mm) for the Elizabethtown-Kitley region (SNOW-MNR-3311). Field monitoring conducted by the RVCA.
DATA TIME-SERIES:
Biweekly, Field Measurement, Snow Depth (SD); centimeters
Biweekly, Field Measurement, Snow Water Equivalent (SWE); millimeters
LOCATION: UTM 18T [X: 427828.5], [Y: 4955926.6]
SUBWATERSHED: Middle Rideau River
PERIOD OF RECORD (RVCA ARCHIVE): Jan/2014 - Present
OWNER/OPERATOR: Rideau Valley Conservation Authority
DATA AVAILABILITY: Biweekly field monitoring from Oct-June
STATISTICS: NA
DATA UNCERTAINTY:
The RVCA cannot guarantee the accuracy of the provided data. Data accuracy can be affected by a number of factors including, but not limited to: Equipment malfunction/maintenance, regional climate conditions and site disturbance. Users of the RVCA's data tools are cautioned to consider the unverified nature of the information before using it for decisions that concern personal or public safety or the conduct of business.
DATA SOURCES:
MNRF Snow Collection Protocol
CONTACT:
For for more information, please contact:
Station Metadata [SNOW-MNR-3309]
STATUS: Active, Seasonal
ABOUT THIS DATA:
The biweekly snow depth (cm) and snow water equivalent (mm) for the Bells Corners region (SNOW-MNR-3309). Field monitoring conducted by the RVCA. Statistics have been generated by the RVCA from the period between 1979-2019 (40 years). These statistics include the biweekly median (50th percentile), interquartile range (data range between the daily 25th and 75th percentiles) and the maximum snow water volume measured over the period of record. The median and interquartile range represent the typical normal snow water volume observed at this time of year over the historic record.
DATA TIME-SERIES:
Biweekly, Field Measurement, Snow Depth (SD); centimeters
Biweekly, Field Measurement, Snow Water Equivalent (SWE); millimeters
Biweekly, Lower Quartile (25th Percentile; Historic Normal Water Equivalent); millimeters
Biweekly, Median (50th Percentile; Historic Normal Water Equivalent); millimeters
Biweekly, Upper Quartile (75th Percentile; Historic Normal Water Equivalent); millimeters
LOCATION: UTM 18T [X: 437156.6], [Y: 5018055.5]
SUBWATERSHED: Ottawa River West
PERIOD OF RECORD (RVCA ARCHIVE): Jan/1979 - Present
OWNER/OPERATOR: Rideau Valley Conservation Authority
DATA AVAILABILITY: Biweekly field monitoring from Oct-June
STATISTICS: RVCA statistics calculated from the 1979-2019 period of record.
a) Upper Quartile (Historic Normal)
Statistics Interval - 1 Year, Recurring
Extraction Interval - Biweekly (15 Days); No Aggregation
Statistics Type: 75th Percentile
Update Frequency: Biweekly
b) Lower Quartile (Historic Normal)
Statistics Interval - 1 Year, Recurring
Extraction Interval - Biweekly (15 Days); No Aggregation
Statistics Type: 25th Percentile
Update Frequency: Biweekly
c) Median (Historic Normal)
Statistics Interval - 1 Year, Recurring
Extraction Interval - Biweekly (15 Days); No Aggregation
Statistics Type: 50th Percentile
Update Frequency: Biweekly
DATA UNCERTAINTY:
The RVCA cannot guarantee the accuracy of the provided data. Data accuracy can be affected by a number of factors including, but not limited to: Equipment malfunction/maintenance, regional climate conditions and site disturbance. Users of the RVCA's data tools are cautioned to consider the unverified nature of the information before using it for decisions that concern personal or public safety or the conduct of business.
DATA SOURCES:
MNRF Snow Collection Protocol
CONTACT:
For for more information, please contact:
More...
Station Metadata [SNOW-MNR-3301]
STATUS: Active, Seasonal
ABOUT THIS DATA:
The biweekly snow depth (cm) and snow water equivalent (mm) for the Ashton region (SNOW-MNR-3301). Field monitoring conducted by the RVCA. Statistics have been generated by the RVCA from the period between 1974-2019 (45 years). These statistics include the biweekly median (50th percentile), interquartile range (data range between the daily 25th and 75th percentiles) and the maximum snow water volume measured over the period of record. The median and interquartile range represent the typical normal snow water volume observed at this time of year over the historic record.
DATA TIME-SERIES:
Biweekly, Field Measurement, Snow Depth (SD); centimeters
Biweekly, Field Measurement, Snow Water Equivalent (SWE); millimeters
Biweekly, Lower Quartile (25th Percentile; Historic Normal Water Equivalent); millimeters
Biweekly, Median (50th Percentile; Historic Normal Water Equivalent); millimeters
Biweekly, Upper Quartile (75th Percentile; Historic Normal Water Equivalent); millimeters
LOCATION: UTM 18T [X: 414244.5], [Y: 5000236.6]
SUBWATERSHED: Jock River
PERIOD OF RECORD (RVCA ARCHIVE): Mar/1974 - Present
OWNER/OPERATOR: Rideau Valley Conservation Authority
DATA AVAILABILITY: Biweekly field monitoring from Oct-June
STATISTICS: RVCA statistics calculated from the 1974-2019 period of record.
a) Upper Quartile (Historic Normal)
Statistics Interval - 1 Year, Recurring
Extraction Interval - Biweekly (15 Days); No Aggregation
Statistics Type: 75th Percentile
Update Frequency: Biweekly
b) Lower Quartile (Historic Normal)
Statistics Interval - 1 Year, Recurring
Extraction Interval - Biweekly (15 Days); No Aggregation
Statistics Type: 25th Percentile
Update Frequency: Biweekly
c) Median (Historic Normal)
Statistics Interval - 1 Year, Recurring
Extraction Interval - Biweekly (15 Days); No Aggregation
Statistics Type: 50th Percentile
Update Frequency: Biweekly
DATA UNCERTAINTY:
The RVCA cannot guarantee the accuracy of the provided data. Data accuracy can be affected by a number of factors including, but not limited to: Equipment malfunction/maintenance, regional climate conditions and site disturbance. Users of the RVCA's data tools are cautioned to consider the unverified nature of the information before using it for decisions that concern personal or public safety or the conduct of business.
DATA SOURCES:
MNRF Snow Collection Protocol
CONTACT:
For for more information, please contact:
INSTRUCTIONS
1) A user-defined time frame can be selected via the "FROM DATE" and "TO DATE" tools above (Date Format: YYYY-M-D). An active 90-day window is loaded by default.
2) Chart and data export functionality is available via the [ ≡ ] icon at the top right of the chart area.
3) Series may be toggled on/off by clicking on the associated legend elements at the bottom of the chart.
4) Data values can be reviewed by hovering over the desired series.
DATA STATUS - PROVISIONAL
The RVCA cannot guarantee the accuracy of the provided data. Data accuracy can be affected by a number of factors including, but not limited to: Ice and/or sediment accumulation, backwater effects and equipment malfunction/maintenance.
Users of the RVCA's real-time data are cautioned to consider the unverified nature of the information before using it for decision that concern personal or public safety or the conduct of business.
STATION METADATA
INSTRUCTIONS
1) A user-defined time frame can be selected via the "FROM DATE" and "TO DATE" tools above (Date Format: YYYY-M-D). An active 90-day window is loaded by default.
2) Chart and data export functionality is available via the [ ≡ ] icon at the top right of the chart area.
3) Series may be toggled on/off by clicking on the associated legend elements at the bottom of the chart.
4) Data values can be reviewed by hovering over the desired series.
DATA STATUS - PROVISIONAL
The RVCA cannot guarantee the accuracy of the provided data. Data accuracy can be affected by a number of factors including, but not limited to: Ice and/or sediment accumulation, backwater effects and equipment malfunction/maintenance. Users of the RVCA's real-time data are cautioned to consider the unverified nature of the information before using it for decision that concern personal or public safety or the conduct of business.
STATION METADATA